Edit chart
Loading graph
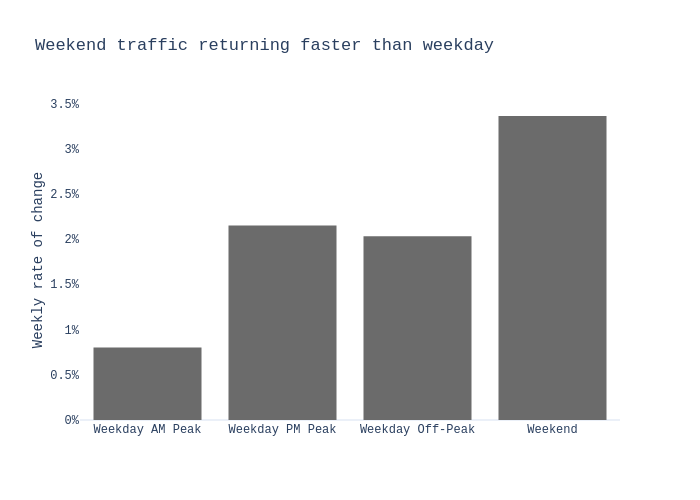
Charlie2343's interactive graph and data of "Weekend traffic returning faster than weekday" is a bar chart; with Weekly rate of change in the y-axis. The x-axis shows values from -0.5 to 3.5. The y-axis shows values from 0 to 3.536842105263158.