Edit chart
Loading graph
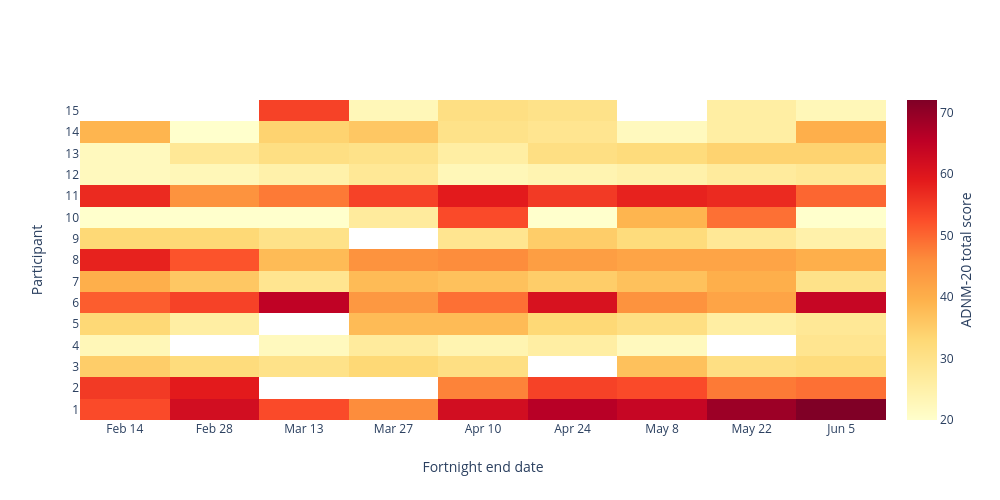
Chantal.simons's interactive graph and data of "Participant vs Fortnight end date" is a heatmap; with Fortnight end date in the x-axis and Participant in the y-axis.. The x-axis shows values from -0.5 to 8.5. The y-axis shows values from -0.5 to 14.5.