Edit chart
Loading graph
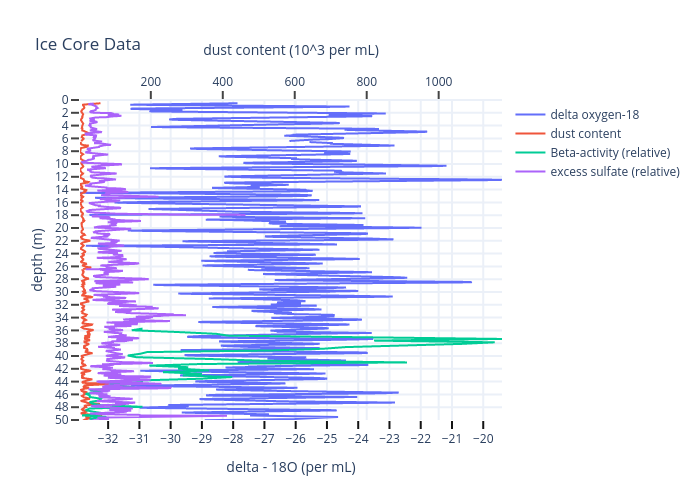
Byrdpolar's interactive graph and data of "Ice Core Data" is a line chart, showing delta oxygen-18, dust content, Beta-activity (relative), excess sulfate (relative) ; with delta - 18O (per mL) in the x-axis and depth (m) in the y-axis.. The x-axis shows values from -32.9 to -19.4. The y-axis shows values from 50 to 0.