Edit chart
Loading graph
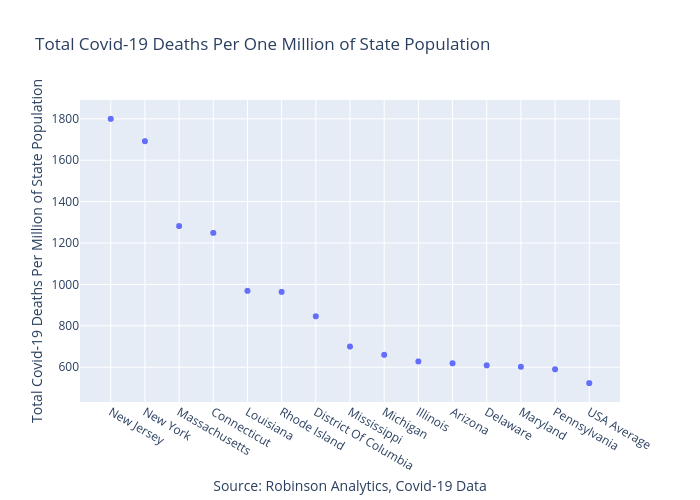
Arobinso's interactive graph and data of "Total Covid-19 Deaths Per One Million of State Population" is a scatter chart; with Source: Robinson Analytics, Covid-19 Data in the x-axis and Total Covid-19 Deaths Per Million of State Population in the y-axis.. The x-axis shows values from -0.8657616892911011 to 14.865761689291102. The y-axis shows values from 397.14499484004125 to 1925.8550051599586.