Edit chart
Loading graph
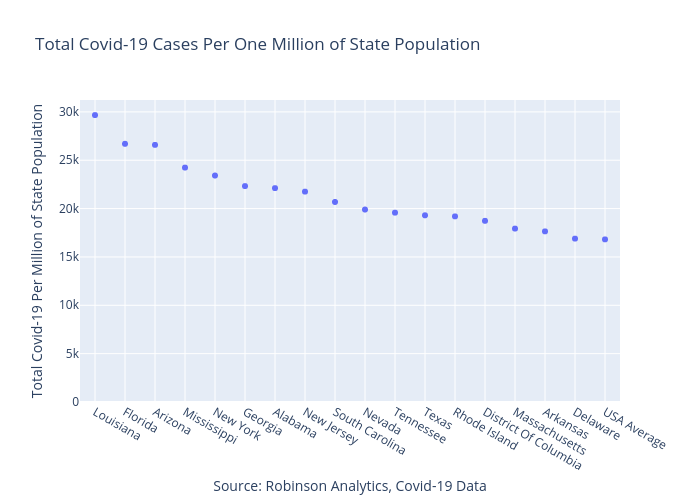
Arobinso's interactive graph and data of "Total Covid-19 Cases Per One Million of State Population" is a scatter chart; with Source: Robinson Analytics, Covid-19 Data in the x-axis and Total Covid-19 Per Million of State Population in the y-axis.. The x-axis shows values from -0.5 to 17.5. The y-axis shows values from 0 to 31228.42105263158.