Edit chart
Loading graph
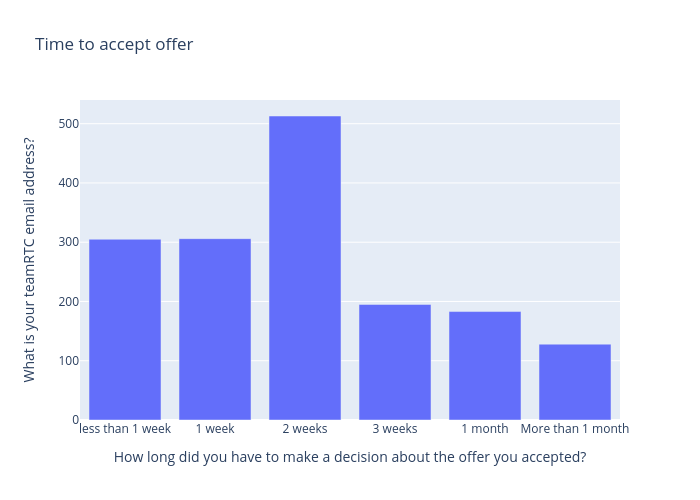
Anoushkatashi's interactive graph and data of "Time to accept offer" is a bar chart; with How long did you have to make a decision about the offer you accepted? in the x-axis and What is your teamRTC email address? in the y-axis.. The x-axis shows values from 0 to 0. The y-axis shows values from 0 to 0.