Edit chart
Loading graph
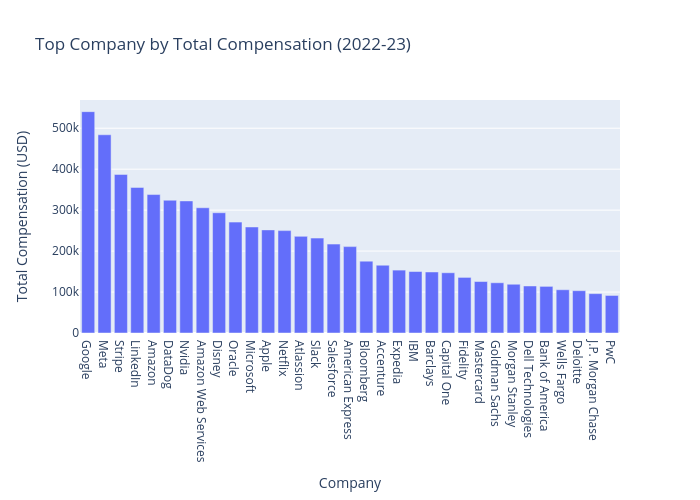
Anoushkatashi's interactive graph and data of "Top Company by Total Compensation (2022-23)" is a bar chart; with Company in the x-axis and Total Compensation (USD) in the y-axis.. The x-axis shows values from 0 to 0. The y-axis shows values from 0 to 0.