Edit chart
Loading graph
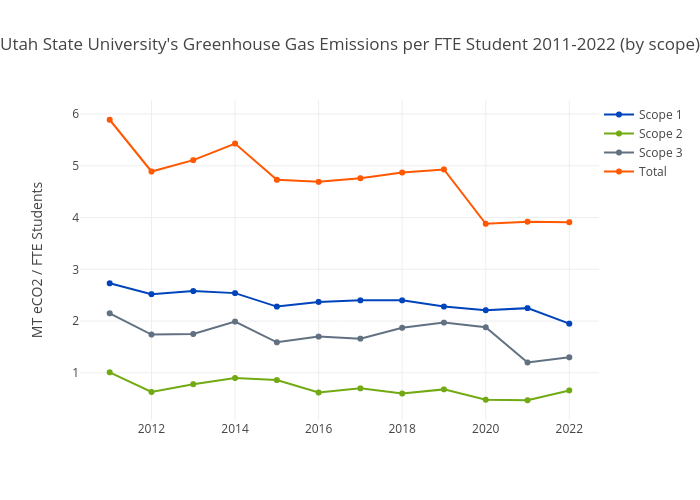
Ususustainability's interactive graph and data of "Utah State University's Greenhouse Gas Emissions per FTE Student 2011-2022 (by scope)" is a scatter chart, showing Scope 1, Scope 2, Scope 3, Total; with MT eCO2 / FTE Students in the y-axis. The x-axis shows values from 2010.3532181492724 to 2022.6467818507276. The y-axis shows values from 0.11846840812681397 to 6.241531591873185.