Edit chart
Loading graph
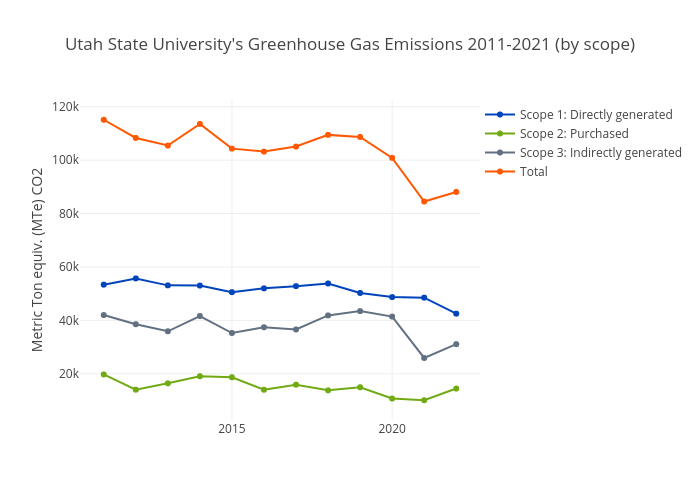
Ususustainability's interactive graph and data of "Utah State University's Greenhouse Gas Emissions 2011-2021 (by scope)" is a scatter chart, showing Scope 1: Directly generated, Scope 2: Purchased, Scope 3: Indirectly generated, Total; with Metric Ton equiv. (MTe) CO2 in the y-axis. The x-axis shows values from 2010.393438609377 to 2021.606561390623. The y-axis shows values from 3913.4481218905476 to 104276.52187810944.