Edit chart
Loading graph
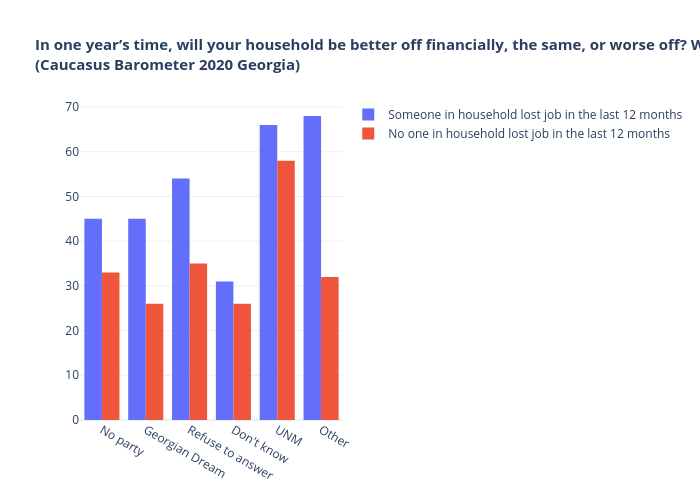
Tsisana_kh's interactive graph and data of "In one year’s time, will your household be better off financially, the same, or worse off? Worse off By Party closest to you(Caucasus Barometer 2020 Georgia)" is a bar chart, showing Someone in household lost job in the last 12 months vs No one in household lost job in the last 12 months. The x-axis shows values from -0.5 to 5.5. The y-axis shows values from 0 to 71.57894736842105.