Edit chart
Loading graph
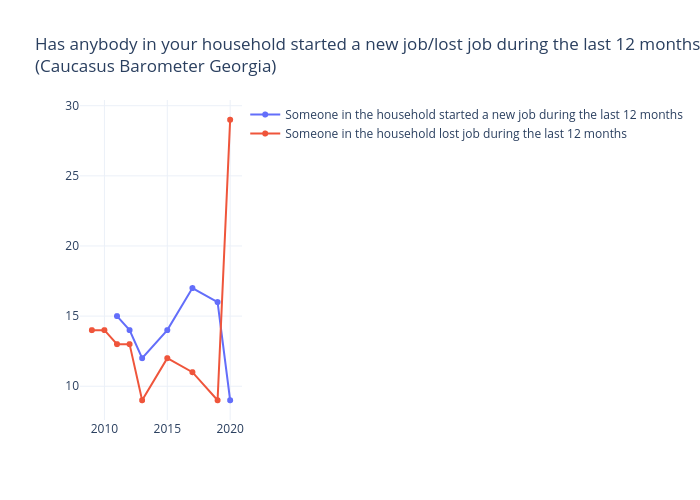
Tsisana_kh's interactive graph and data of "Has anybody in your household started a new job/lost job during the last 12 months? (%) (Caucasus Barometer Georgia)" is a , showing Someone in the household started a new job during the last 12 months vs Someone in the household lost job during the last 12 months. The x-axis shows values from 2008.1700095510985 to 2020.8299904489015. The y-axis shows values from 7.294075660242684 to 30.705924339757317.