Edit chart
Loading graph
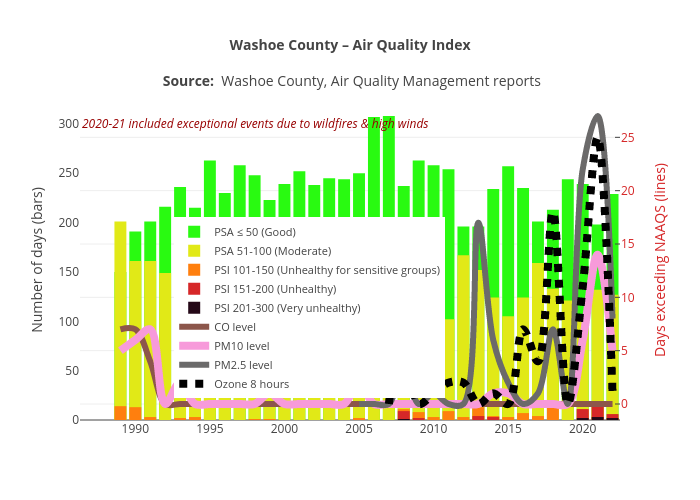
Truckeemeadowstomorrow's interactive graph and data of "Washoe County – Air Quality Index Source: Washoe County, Air Quality Management reports" is a overlaid bar chart, showing PSA ≤ 50 (Good), PSA 51-100 (Moderate), PSI 101-150 (Unhealthy for sensitive groups), PSI 151-200 (Unhealthy), PSI 201-300 (Very unhealthy), CO level, PM10 level, PM2.5 level, Ozone 8 hours; with Number of days (bars) in the y-axis. The x-axis shows values from 1988.5 to 2022.5. The y-axis shows values from 0 to 324.2105263157895. This visualization has the following annotation: 2020-21 included exceptional events due to wildfires & high winds