Edit chart
Loading graph
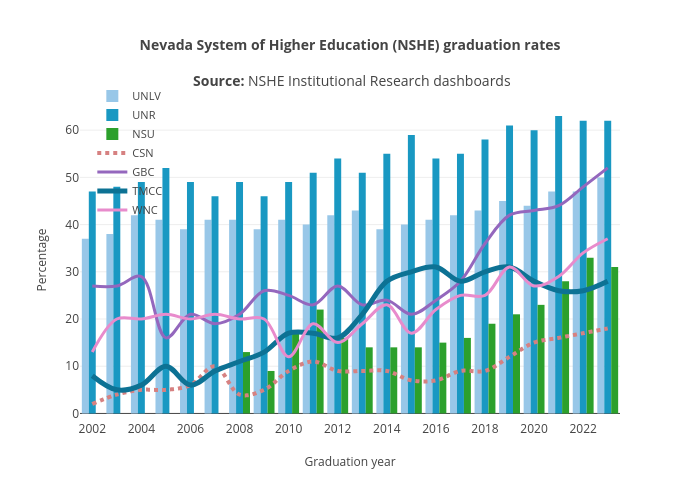
Truckeemeadowstomorrow's interactive graph and data of "Nevada System of Higher Education (NSHE) graduation rates Source: NSHE Institutional Research dashboards" is a grouped bar chart, showing UNLV, UNR, NSC, CSN, GBC, TMCC, WNC; with Graduation year in the x-axis and Percentage in the y-axis.. The x-axis shows values from 2001.5 to 2023.5. The y-axis shows values from -1.3888888888888888 to 66.38888888888889.