Edit chart
Loading graph
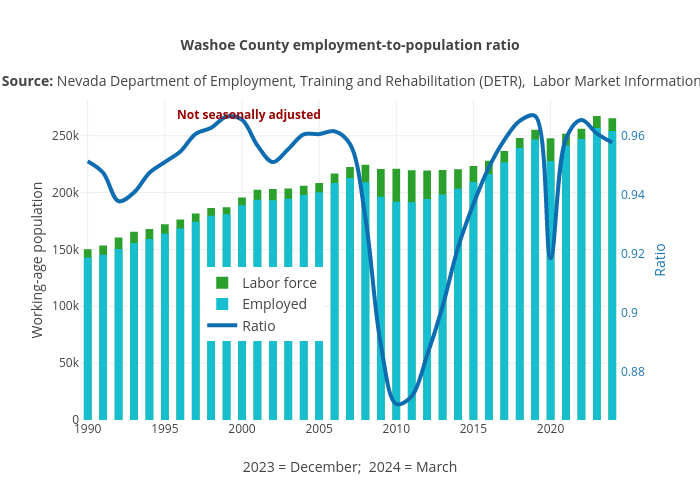
Truckeemeadowstomorrow's interactive graph and data of "Washoe County employment-to-population ratio Source: Nevada Department of Employment, Training and Rehabilitation (DETR), Labor Market Information" is a overlaid bar chart, showing Labor force, Employed, Ratio; with 2023 = December; 2024 = February in the x-axis and Working-age population in the y-axis.. The x-axis shows values from 1989.5 to 2024.5. The y-axis shows values from 0 to 281403.15789473685. This visualization has the following annotation: Not seasonally adjusted