Edit chart
Loading graph
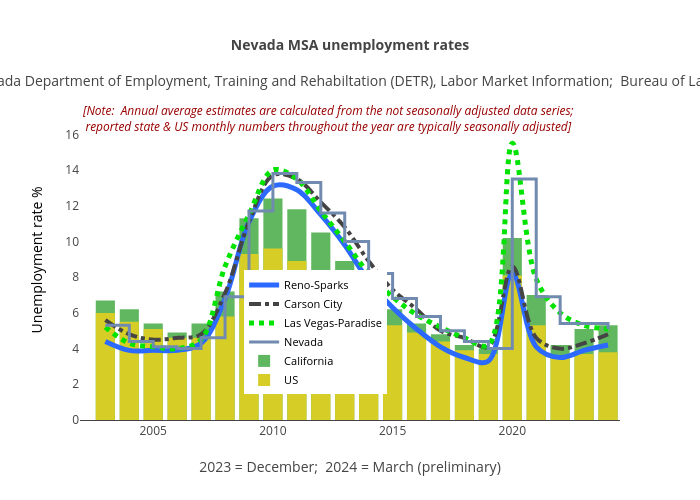
Truckeemeadowstomorrow's interactive graph and data of "Nevada MSA unemployment rates Source: Nevada Department of Employment, Training and Rehabiltation (DETR), Labor Market Information; Bureau of Labor Statistics" is a line chart, showing Reno-Sparks, Carson City, Las Vegas-Paradise, Nevada, California, US; with 2023 = December; 2024 = February (preliminary) in the x-axis and Unemployment rate % in the y-axis.. The x-axis shows values from 2002.5 to 2024.5. The y-axis shows values from 0 to 17.505731274918585. This visualization has the following annotation: [Note: Annual average estimates are calculated from the not seasonally adjusted data series;reported state & US monthly numbers throughout the year are typically seasonally adjusted]