Edit chart
Loading graph
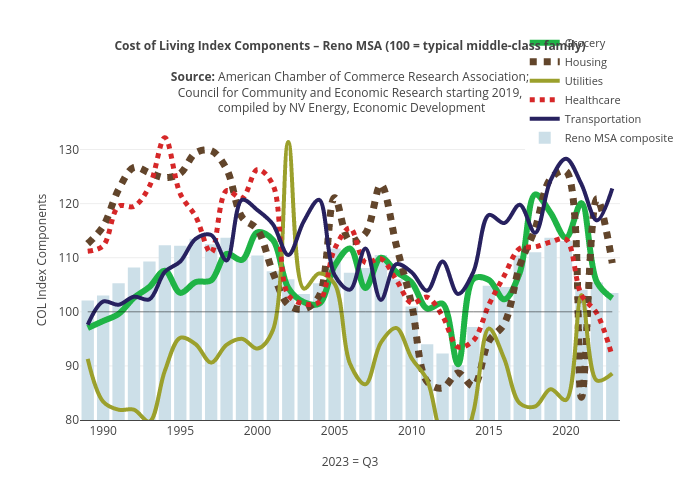
Truckeemeadowstomorrow's interactive graph and data of "Cost of Living Index Components – Reno MSA (100 = typical middle-class family) Source: American Chamber of Commerce Research Association; Council for Community and Economic Research starting 2019, compiled by NV Energy, Economic Development" is a line chart, showing Grocery, Housing, Utilities, Healthcare, Transportation, Index, Reno MSA composite; with 2023 = Q3 in the x-axis and COL Index Components in the y-axis.. The x-axis shows values from 1988.5 to 2023.5. The y-axis shows values from 80 to 139.15789473684208.