Edit chart
Loading graph
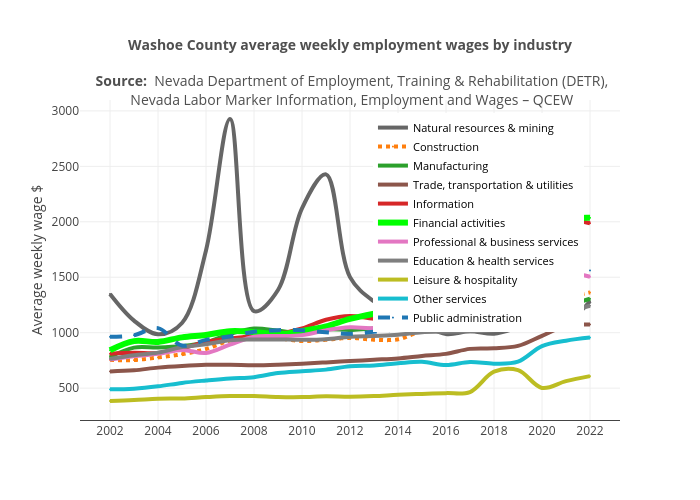
Truckeemeadowstomorrow's interactive graph and data of "Washoe County average weekly employment wages by industry Source: Nevada Department of Employment, Training & Rehabilitation (DETR), Nevada Labor Marker Information, Employment and Wages – QCEW" is a line chart, showing Natural resources & mining, Construction, Manufacturing, Trade, transportation & utilities, Information, Financial activities, Professional & business services, Education & health services, Leisure & hospitality, Other services, Public administration; with in the x-axis and Average weekly wage $ in the y-axis.. The x-axis shows values from 2000.8051262721447 to 2023.1948737278553. The y-axis shows values from 223.19523151347616 to 3087.8047684865237.