Edit chart
Loading graph
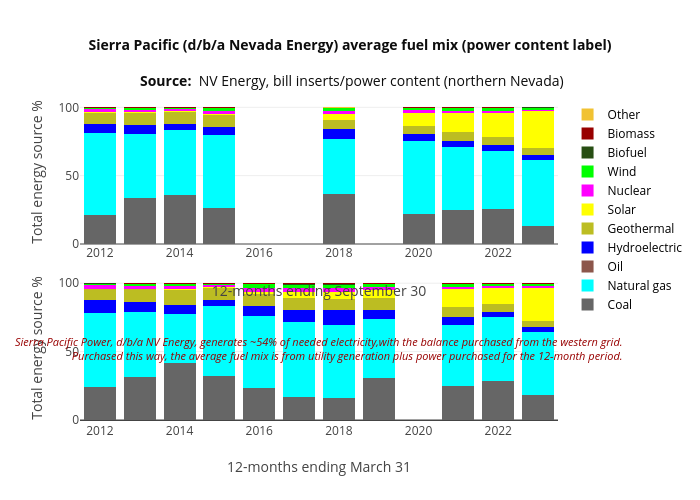
Truckeemeadowstomorrow's interactive graph and data of "Sierra Pacific (d/b/a Nevada Energy) average fuel mix (power content label) Source: NV Energy, bill inserts/power content (northern Nevada)" is a stacked bar chart, showing Coal, Natural gas, Oil, Hydroelectric, Geothermal, Solar, Nuclear, Wind, Biofuel, Biomass, Other, Coal, Natural gas, Oil, Hydroelectric, Geothermal, Solar, Nuclear, Wind, Biofuel, Biomass, Other; with 12-months ending March 31 in the x-axis and Total energy source % in the y-axis.. The x-axis shows values from 2011.5 to 2023.5. The y-axis shows values from 0 to 105.26315789473688. This visualization has the following annotation: Sierra Pacific Power, d/b/a NV Energy, generates ~54% of needed electricity,with the balance purchased from the western grid.Purchased this way, the average fuel mix is from utility generation plus power purchased for the 12-month period.