Edit chart
Loading graph
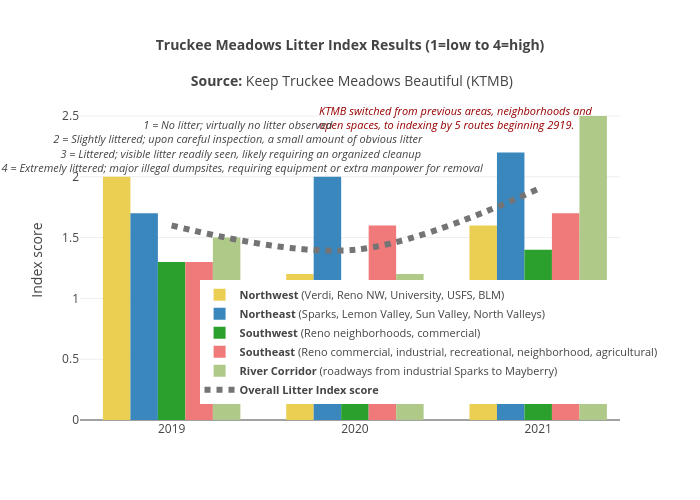
Truckeemeadowstomorrow's interactive graph and data of "Truckee Meadows Litter Index Results (1=low to 4=high) Source: Keep Truckee Meadows Beautiful (KTMB)" is a grouped bar chart, showing Northwest (Verdi, Reno NW, University, USFS, BLM), Northeast (Sparks, Lemon Valley, Sun Valley, North Valleys), Southwest (Reno neighborhoods, commercial), Southeast (Reno commercial, industrial, recreational, neighborhood, agricultural), River Corridor (roadways from industrial Sparks to Mayberry), Overall Litter Index score; with Index score in the y-axis. The x-axis shows values from 2018.5 to 2021.4463823211404. The y-axis shows values from 0 to 2.6315789473684212. This visualization has the following annotations: KTMB switched from previous areas, neighborhoods and open spaces, to indexing by 5 routes beginning 2919.; 1 = No litter; virtually no litter observed2 = Slightly littered; upon careful inspection, a small amount of obvious litter 3 = Littered; visible litter readily seen, likely requiring an organized cleanup 4 = Extremely littered; major illegal dumpsites, requiring equipment or extra manpower for removal