Edit chart
Loading graph
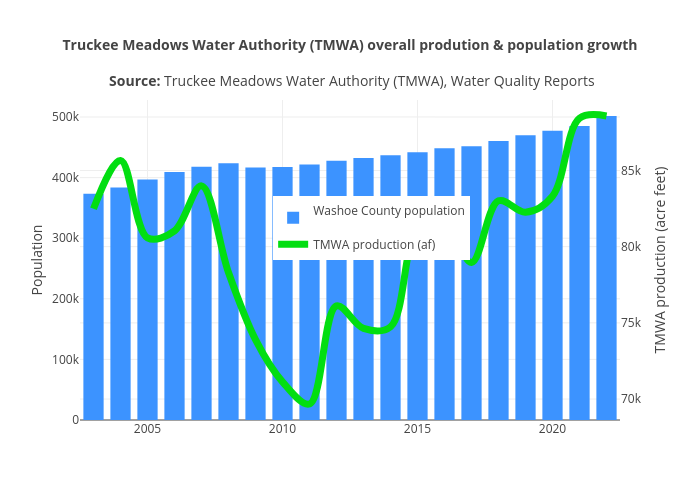
Truckeemeadowstomorrow's interactive graph and data of "Truckee Meadows Water Authority (TMWA) overall prodution & population growth Source: Truckee Meadows Water Authority (TMWA), Water Quality Reports" is a grouped bar chart, showing Washoe County population vs TMWA production (af); with in the x-axis and Population in the y-axis.. The x-axis shows values from 2002.5 to 2022.5. The y-axis shows values from 0 to 528036.8421052631.