Edit chart
Loading graph
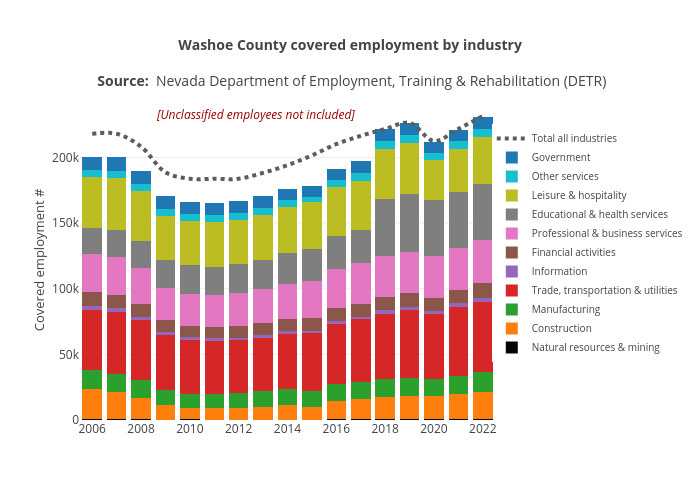
Truckeemeadowstomorrow's interactive graph and data of "Washoe County covered employment by industry Source: Nevada Department of Employment, Training & Rehabilitation (DETR)" is a stacked bar chart, showing Natural resources & mining, Construction, Manufacturing, Trade, transportation & utilities, Information, Financial activities, Professional & business services, Educational & health services, Leisure & hospitality, Other services, Government, Total all industries; with in the x-axis and Covered employment # in the y-axis.. The x-axis shows values from 2005.5 to 2022.5. The y-axis shows values from 0 to 243844.2105263158. This visualization has the following annotation: [Unclassified employees not included]