Edit chart
Loading graph
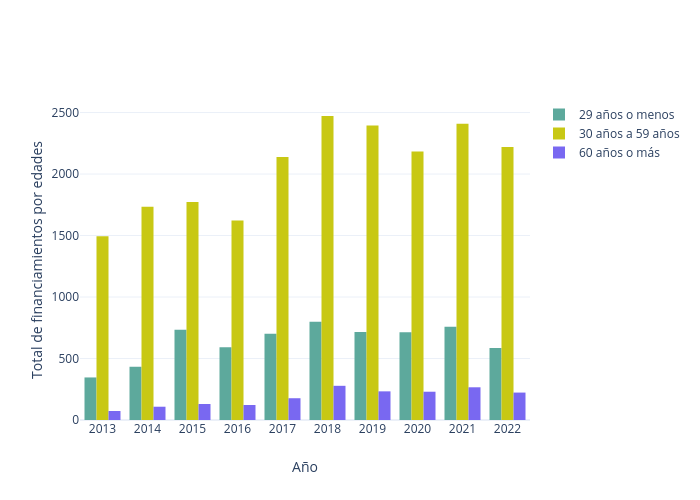
Sigem's interactive graph and data of "Total de financiamientos por edades vs Año" is a bar chart, showing 29 años o menos, 30 años a 59 años , 60 años o más, 29 años o menos, 30 años a 59 años, 60 años o más; with Año in the x-axis and Total de financiamientos por edades in the y-axis.. The x-axis shows values from 2012.5 to 2022.5. The y-axis shows values from 0 to 2602.1052631578946.