Edit chart
Loading graph
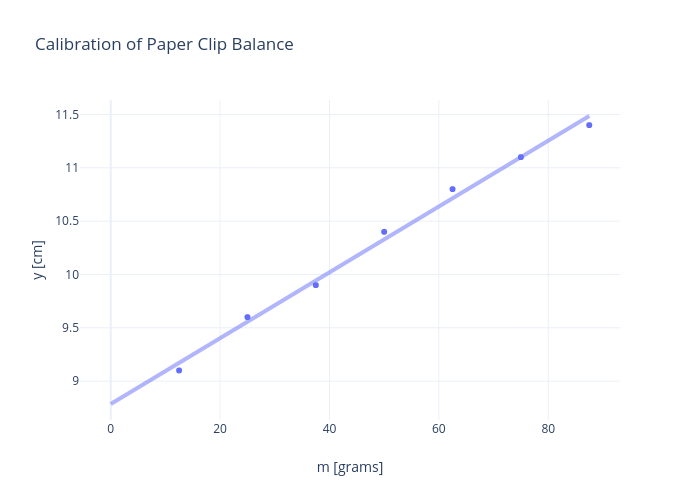
Rhettallain's interactive graph and data of "Calibration of Paper Clip Balance" is a scatter chart; with m [grams] in the x-axis and y [cm] in the y-axis.. The x-axis shows values from -5.469662827574697 to 92.9696628275747. The y-axis shows values from 8.635714285714315 to 11.635714285714263.