Edit chart
Loading graph
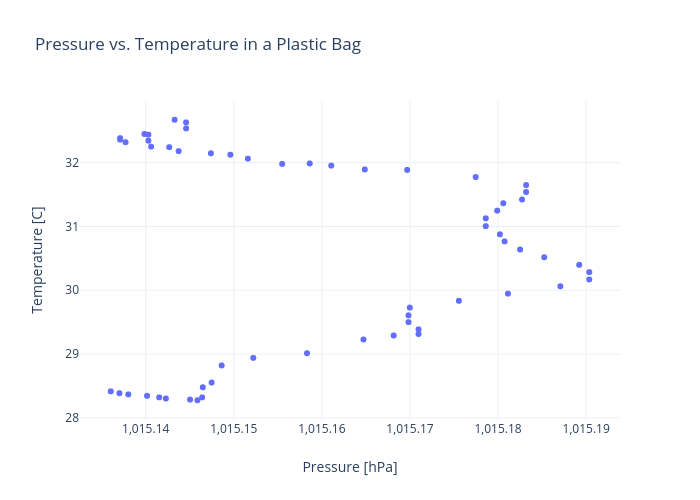
Rhettallain's interactive graph and data of "Pressure vs. Temperature in a Plastic Bag" is a scatter chart; with Pressure [hPa] in the x-axis and Temperature [C] in the y-axis.. The x-axis shows values from 1015.1327020065789 to 1015.193677993421. The y-axis shows values from 27.931408658184765 to 33.01755394181524.