Edit chart
Loading graph
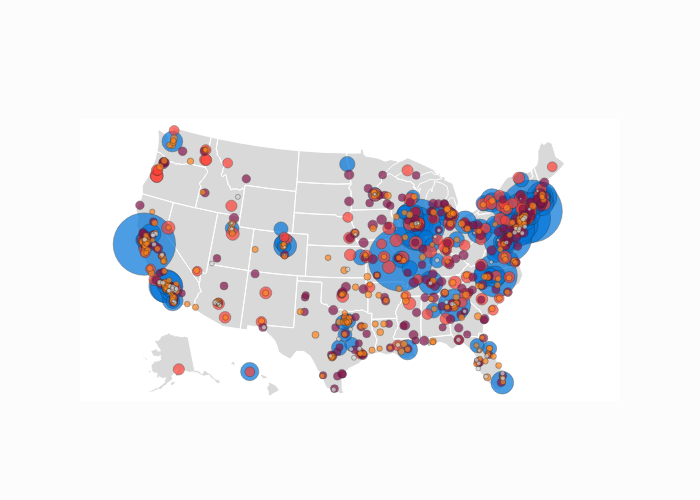
Novuslex's interactive graph and data of "" is a scattergeo, showing 1-100, 101 - 250, 251 - 500, 501 - 750, 750 - 1000. The x-axis shows values from 0 to 0. The y-axis shows values from 0 to 0.