Edit chart
Loading graph
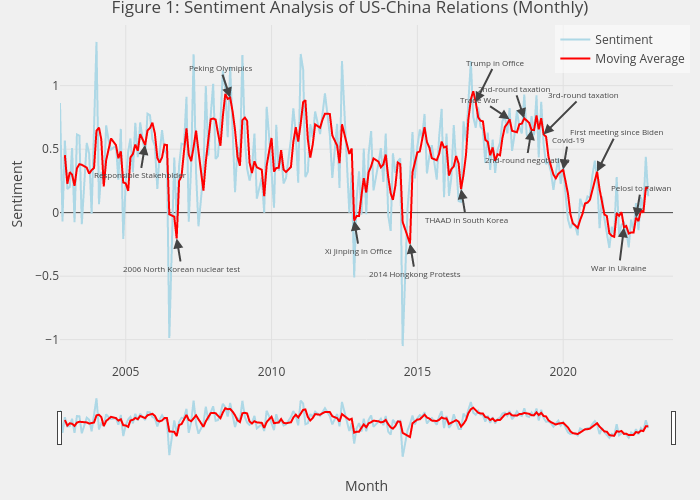
Linying's interactive graph and data of "Figure 1: Sentiment Analysis of US-China Relations (Monthly)" is a line chart, showing Sentiment vs Moving Average; with Month in the x-axis and Sentiment in the y-axis.. The x-axis shows values from 2002-10-01 to 2023-06-03 19:46:37.9747. The y-axis shows values from -1.1839831149798605 to 1.4774390355263507. This visualization has the following annotations: Responsible Stakeholder; 2006 North Korean nuclear test; Peking Olymipics; Xi Jinping in Office; 2014 Hongkong Protests; THAAD in South Korea; Trump in Office; Trade War; 2nd-round taxation; 2nd-round negotiation; 3rd-round taxation; Covid-19; First meeting since Biden; War in Ukraine; Pelosi to Taiwan