Edit chart
Loading graph
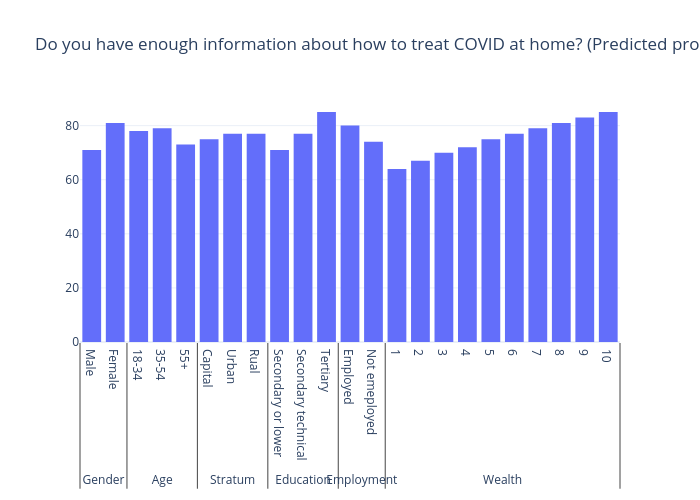
Gilbreathdustin's interactive graph and data of "Do you have enough information about how to treat COVID at home? (Predicted probability yes)" is a bar chart. The x-axis shows values from -0.5 to 22.5. The y-axis shows values from 0 to 89.47368421052632.