Edit chart
Loading graph
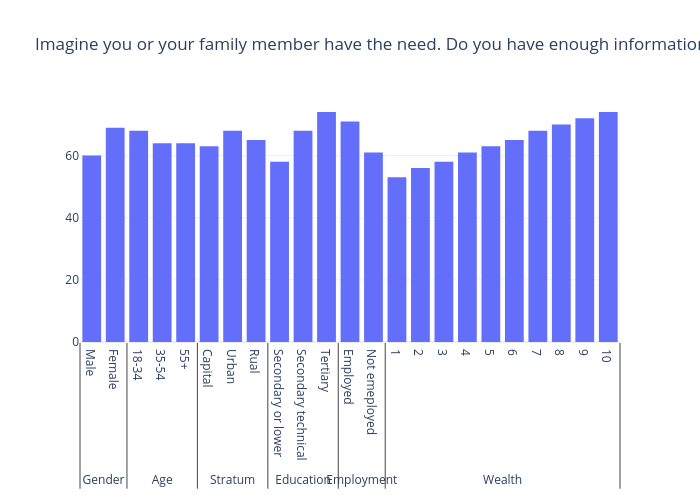
Gilbreathdustin's interactive graph and data of "Imagine you or your family member have the need. Do you have enough information about how to get medical assistance (Predicted probability yes)" is a bar chart. The x-axis shows values from -0.5 to 22.5. The y-axis shows values from 0 to 77.89473684210526.