Edit chart
Loading graph
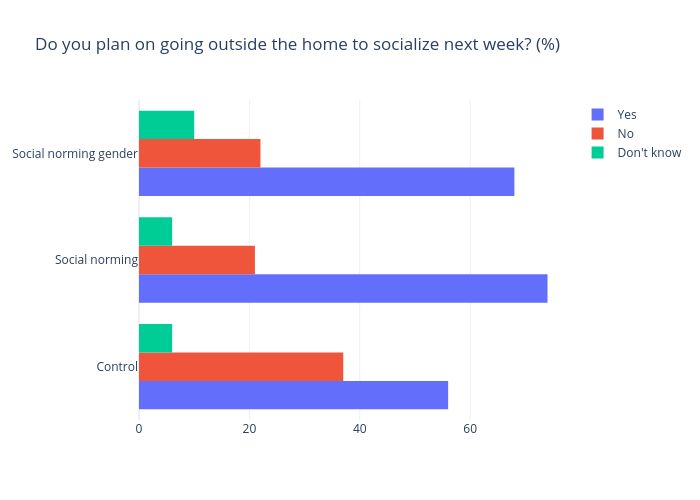
Gilbreathdustin's interactive graph and data of "Do you plan on going outside the home to socialize next week? (%)" is a bar chart, showing Yes, No, Don't know. The x-axis shows values from 0 to 77.89473684210526. The y-axis shows values from -0.5 to 2.5.