Edit chart
Loading graph
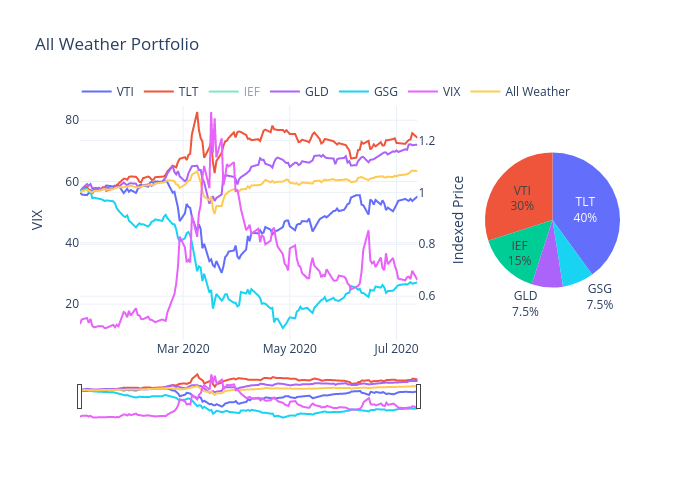
69eens's interactive graph and data of "All Weather Portfolio" is a line chart, showing VTI, TLT, IEF, GLD, GSG, VIX, All Weather; with Indexed Price in the y-axis. The x-axis shows values from 2020-01-02 to 2020-07-13. The y-axis shows values from 0.43153168617197996 to 1.355505013043976.