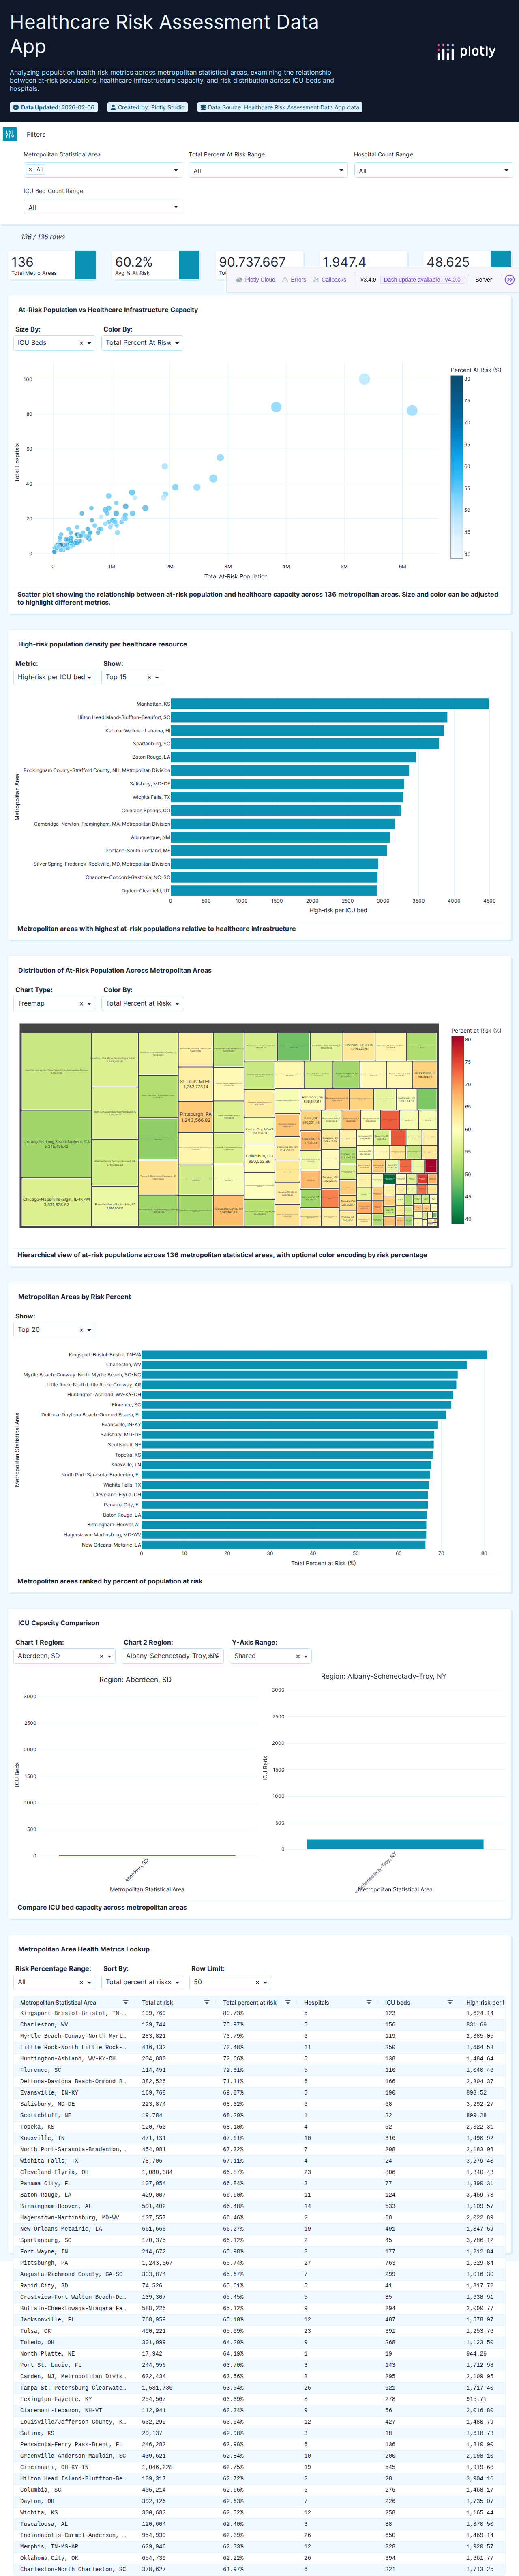
Metro ICU Beds
Metropolitan area ICU bed capacity data.
Public Health & EpidemiologyPASSED
1m
April 23 | Jumpstart your data app journey and get live support with Plotly Studio. Reserve your spot.
Stop wrestling with throwaway AI code. Plotly Studio is the desktop application that turns complex data questions into interactive, enterprise-ready dashboards you can share with your data team instantly.
START FOR FREE


Answer your biggest data analysis questions with AI agents that help you
create precise, sophisticated, and interactive charts at the speed of thought.
|
Chart appears when prompt is complete...
See how Plotly Studio builds, iterates, and deploys professional AI dashboards and interactive data apps in less than two minutes.
Built on ten years of Plotly expertise that corrects errors, adds domain knowledge, and builds reliable data apps better than other AI analysis platforms.
92.5%
Success Rate
CI: 89.0-96.0%
302
Total Datasets
Total attempts
98s
Median Generation Time
Across all attempts
1 KB - 25 MB
File Size
min. - max.
Metro ICU Beds
Metropolitan area ICU bed capacity data.
Public Health & Epidemiology1m
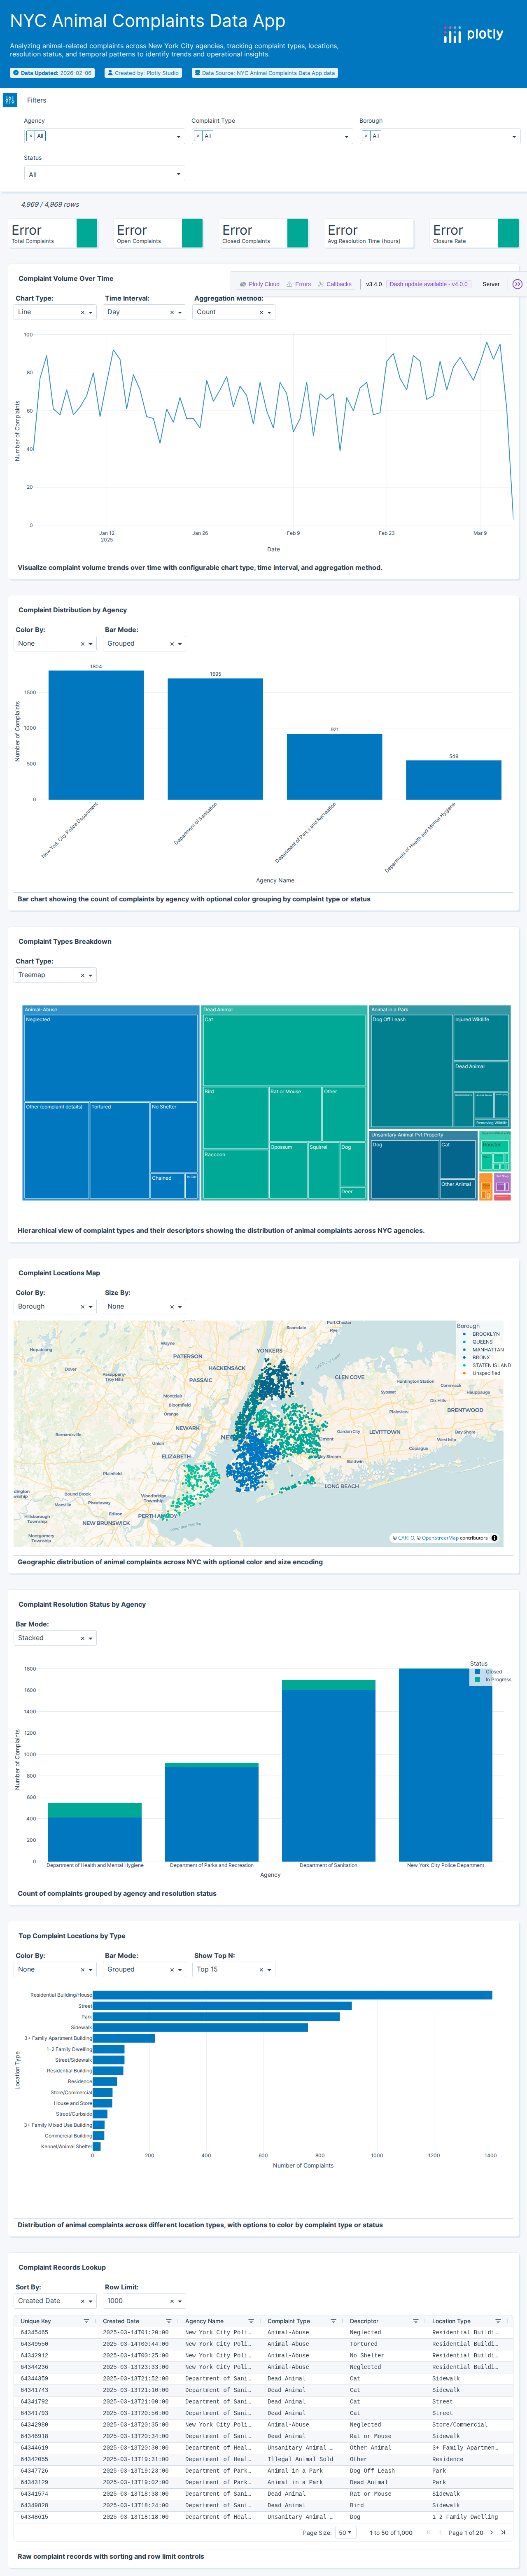
311 Animal Complaints
NYC 311 service requests related to animal complaints.
Government & Public Services1m
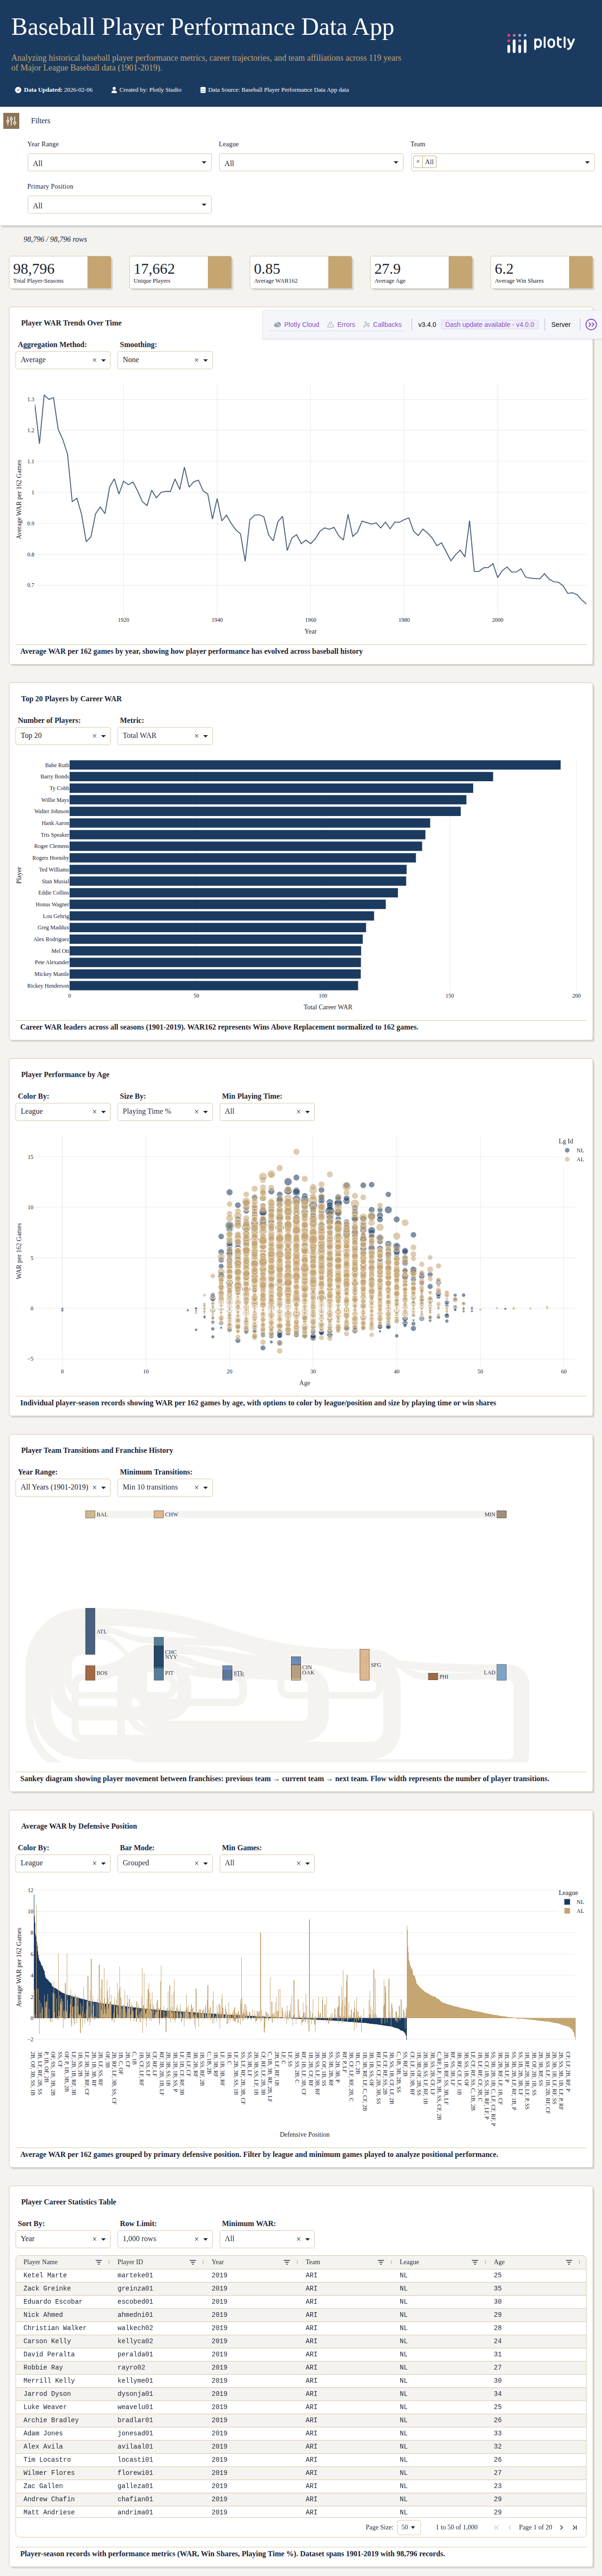
Basketball Win Shares
Basketball quasi win shares advanced analytics.
Sports & Recreation1m
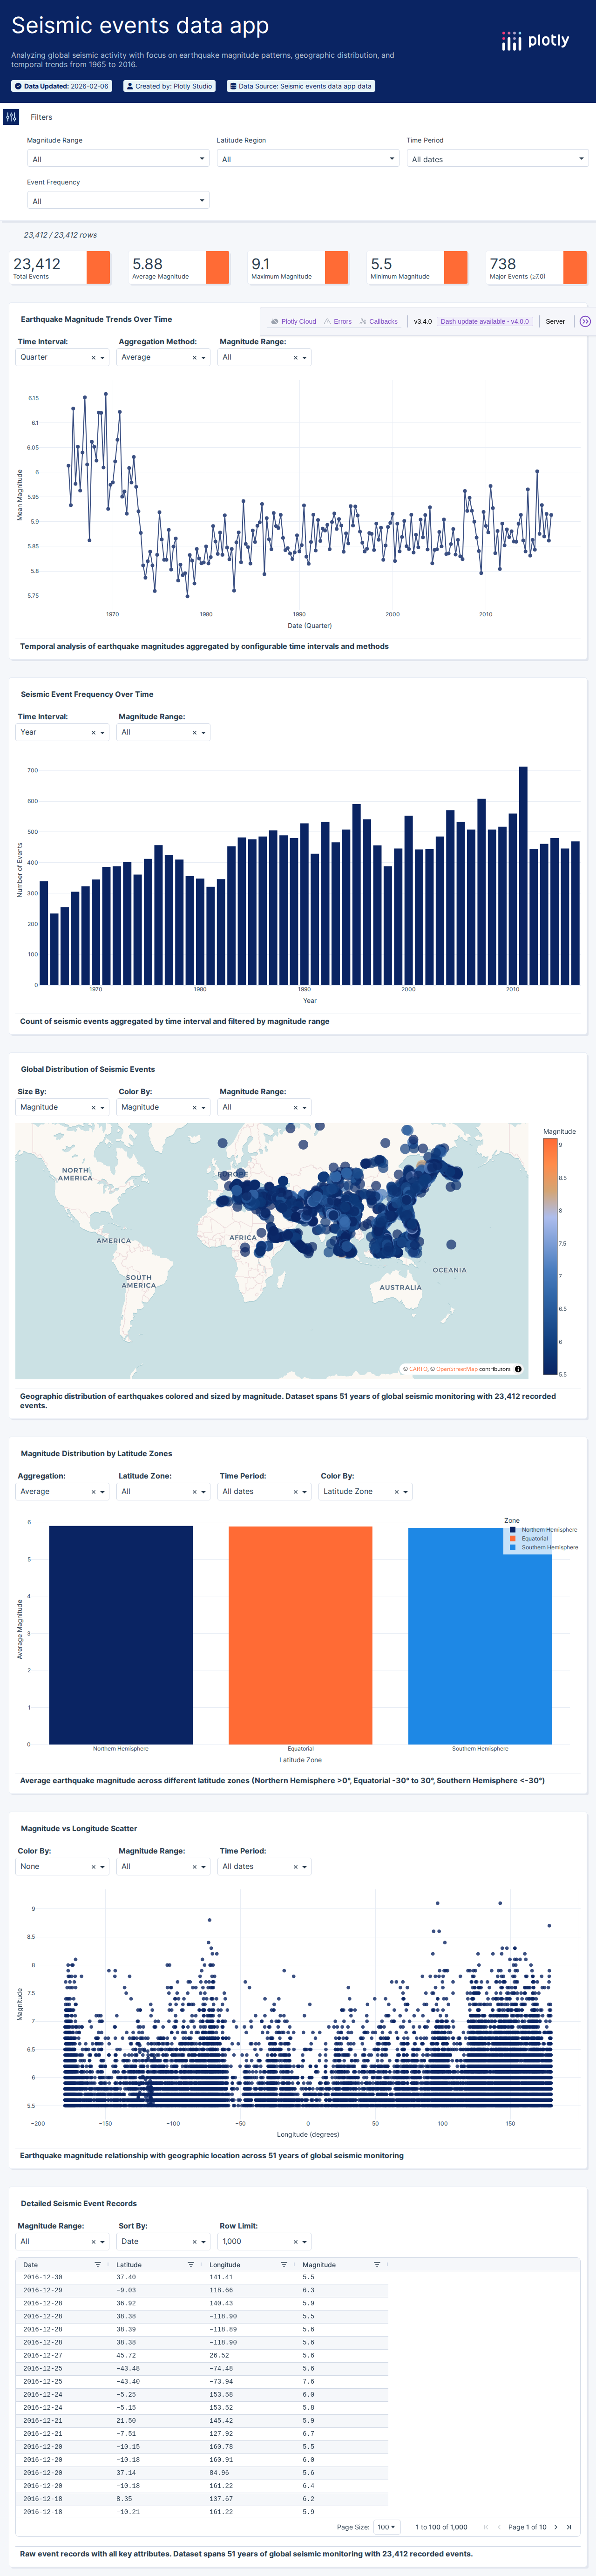
Earthquakes (23K Events)
Large earthquake dataset with 23,000 seismic events.
Geospatial Data1m
If Python can connect to it, so can Plotly Studio. We leverage the entire Python ecosystem to reach your data wherever it lives, from Snowflake and S3 to legacy APIs and messy CSVs. Blend datasets instantly to find relationships that standard BI tools miss.
Deploy Plotly Studio apps on-premise or in your private cloud with our Dash Enterprise platform, never exposing your data to the public internet.

ISO 27001, 27701, 42001
SOC 2 Type II
GDPR
Learn why data teams are moving past generic AI tools and rigid BI tools:
| What you get | Plotly Studio | Vibe-coding tools (Cursor, Replit, Claude) | Traditional BI (Tableau, Power BI) |
|---|---|---|---|
| Output quality | Production Python apps | Developer skill-dependent | Closed-source dashboards |
| AI reliability | Verified & benchmarked | Hallucination-prone | Limited |
| Visualization best practices | Industry-leading | Model-dependent | Limited |
| AI assistance | Fully assisted | Manual vibe-coding | Limited AI assistance |
| Data cleaning | AI assisted | Manual vibe-coding | Manual queries |
| Development flexibility | Flexible with defaults | Unlimited | Extremely limited |
| Data sources | Flexible connections built with trained AI | Flexible connections built with stock AI | Conventional connectors |
| Deployment | One-click deployment | Artifacts or roll-your-own | One-click deployment |
| Code available/editable | Yes | Yes | No |
| Vendor lock-in | No | No | Yes |
| Authentication | Teams | User access | Teams |

This is where AI innovation really shines. It helped spark ideas I might’ve missed after staring at the same data too long. When you’re stuck, that fresh perspective is gold. I can jump right in, tweak the code, rearrange the layout, and even publish it to the cloud with ease.
— Arich Knaub
Data scientist & ML engineer

Plotly Studio: finish your month-end accounting reports in only 5 minutes with no formulas, no coding, no point-and-click designing, no queries. Plotly Studio's AI created a dozen prompts and visuals automatically.
— Art Tennick
Technical editor & 3 US patents in BI

I have no affiliate or financial relationship with Plotly. Just extremely impressed with how they have built this analysis and visualization front end from the ground up to fully leverage the strength of frontier AI models and cutting-edge AI tools.
— Brian Julius
Independent Consultant & Expert Power BI user
Download today for free and get started with Plotly Studio.


